 WhatsApp


Subscribe to our
You checked your blood sugar. Now you are staring at a number on your glucometer or lab report — and you have no idea if it is normal, borderline, or dangerous.
That single moment of uncertainty is experienced by over 101 million diabetic Indians and 136 million pre-diabetic Indians every single day. Most search for a chart. Most charts they find are vague, copied from American guidelines without India-specific context, or simply wrong about what is actually normal for your age.
Blood glucose is the concentration of sugar (specifically glucose) dissolved in your bloodstream at any given moment. Glucose is your body's primary energy currency. Every organ — your brain, heart, kidneys, and muscles — runs on it.
When this system works perfectly, blood sugar stays within a narrow, healthy band throughout the day — never dangerously high, never dangerously low.
Here is exactly what happens after every meal:
Step 1: You eat food containing carbohydrates — rice, roti, fruit, milk.
Step 2: Your digestive system breaks those carbohydrates into glucose molecules.
Step 3: Glucose enters the bloodstream through the small intestine wall.
Step 4: Your blood glucose level rises.
Step 5: The beta cells in your pancreas detect the rise and release insulin into the blood.
Step 6: Insulin acts like a molecular key. It binds to cell receptors, unlocking them so glucose can enter and be burned for energy or stored as glycogen.
Step 7: Blood glucose falls back toward the fasting baseline within 2 hours.
No single blood sugar number is normal for every age. Physiological changes across the lifespan — declining insulin sensitivity, loss of muscle mass, hormonal transitions, and changing kidney function — progressively shift what is considered acceptable.
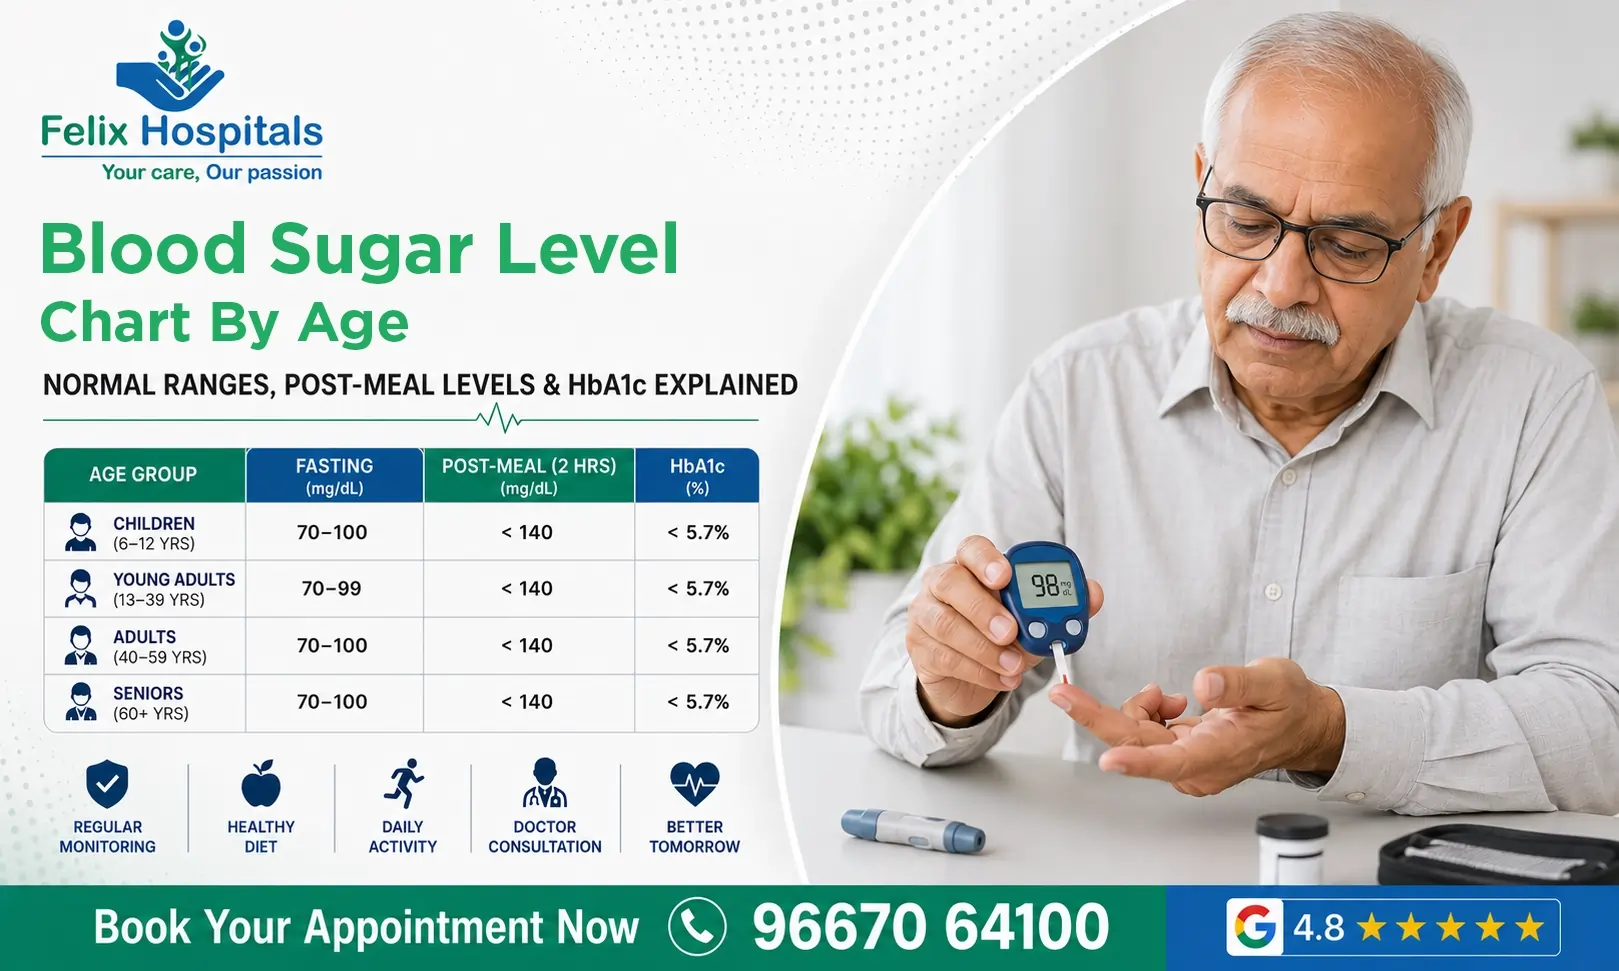
Age Group | Fasting (mg/dL) | Post-Meal 2hr (mg/dL) | HbA1c Target |
Infants (0 to 2 yrs) | 80 to 120 | Not routinely measured | Below 8.5% |
Children (3 to 5 yrs) | 80 to 110 | 110 to 200 | Below 8.5% |
Children (6 to 12 yrs) | 80 to 100 | 100 to 140 | Below 8.0% |
Teenagers (13 to 19) | 70 to 100 | 90 to 140 | Below 7.5% |
Young Adults (20 to 39) | 70 to 99 | Less than 140 | Below 5.7% |
Middle-Age (40 to 59) | 70 to 99 | Less than 140 | Below 5.7% |
Senior (60 to 70 yrs) | 90 to 130 | Less than 180 | Below 7.5% |
Elderly (Above 70 yrs) | 100 to 140 | Less than 200 | Below 8.0% |
Most people assume tighter control is always better. For patients above 70 years, this assumption is clinically dangerous. In elderly patients, hypoglycemia (dangerously low blood sugar) carries a disproportionately high risk of falls with hip fractures, cardiac arrhythmias, strokes, severe confusion, and loss of hypoglycemia awareness. ADA, ICMR, and the International Society for Gerontology all recommend slightly higher glucose targets for patients above 65 to 70 years to maintain a protective buffer against hypoglycemia. Aggressive glucose lowering in an 80-year-old is not better medicine — it is reckless medicine.
Children, particularly those with Type 1 diabetes, require individualized targets because their brains are still developing, growth hormones during puberty significantly increase insulin resistance, and hypoglycemia in children causes cognitive impairment affecting learning and development.
The standard reference ranges apply to all non-pregnant women outside specific hormonal phases. However, women experience three distinct life periods where blood sugar interpretation and targets change significantly.
During pregnancy, the placenta produces hormones that naturally induce insulin resistance. In some women, this resistance becomes excessive, resulting in gestational diabetes mellitus (GDM). GDM affects approximately 20 to 25% of pregnant women in urban India — one of the highest rates globally.
Screening: All pregnant Indian women should undergo GDM screening between weeks 24 and 28 using the 75g Oral Glucose Tolerance Test (OGTT).
Test Point | Normal in Pregnancy | GDM Diagnosis Threshold |
Fasting | Less than 92 mg/dL | 92 mg/dL or above |
1-Hour Post 75g Glucose | Less than 180 mg/dL | 180 mg/dL or above |
2-Hour Post 75g Glucose | Less than 153 mg/dL | 153 mg/dL or above |
Even one value at or above these thresholds is sufficient for GDM diagnosis.
Management Targets During Pregnancy:
GDM mothers have a 35 to 60% lifetime risk of developing Type 2 diabetes and require postpartum glucose testing at 6 to 12 weeks and annually thereafter.
PCOS affects 20 to 25% of Indian women of reproductive age. Up to 70% have some degree of insulin resistance — even those who are thin or normal weight. Annual fasting blood sugar, HbA1c, and 2-hour OGTT screening is recommended from the time of PCOS diagnosis.
The sharp decline in estrogen during perimenopause (typically ages 45 to 52) directly reduces insulin sensitivity at the cellular level. Many women experience their first pre-diabetic reading during this transition — often attributing symptoms like fatigue and weight gain to menopause rather than metabolic change.
Recommendation: All women above 45 years, and women above 40 years with PCOS, weight gain, or family history of diabetes, should have an annual fasting blood sugar and HbA1c test.
Your blood glucose is not one static number. It changes continuously through the day. Doctors use four distinct test types — each measured under specific conditions — to build a full clinical picture.
The DECODE study confirmed that elevated post-meal glucose is a stronger predictor of cardiovascular death than elevated fasting glucose — yet most people only check fasting.
Test Type | Normal (Non-Diabetic) | Pre-Diabetes Range | Diabetes (Confirmed) |
Fasting (FBS) | 70 to 99 mg/dL | 100 to 125 mg/dL | 126 mg/dL or above |
Post-Meal 2hr (PPBS) | Less than 140 mg/dL | 140 to 199 mg/dL | 200 mg/dL or above |
Random (RBS) | Less than 140 mg/dL | 140 to 199 mg/dL | 200+ mg/dL + symptoms |
HbA1c | Below 5.7% | 5.7% to 6.4% | 6.5% or above |
Diagnosis Rule: A single abnormal result does not confirm diabetes. Two abnormal readings on separate days, or one confirmed HbA1c of 6.5% or above, are required — except in the presence of unambiguous symptoms with a random reading above 200 mg/dL.
The reference blood sugar ranges for men are identical to the standard charts. However, the specific risk pattern of Indian men creates a need for earlier and more aggressive screening.
The Thin-Fat Indian Paradox:
Research by Dr. C.S. Yajnik and the Pune Maternal Nutrition Study established that Indians develop insulin resistance and metabolic disease at significantly lower body weights than Western populations.
An Indian man with a BMI of 23 kg/m² — technically 'normal weight' — may already have the same metabolic risk as a Caucasian man with a BMI of 27 to 28 kg/m². Indian bodies carry a disproportionately higher percentage of body fat relative to muscle at any given BMI, resulting in higher visceral fat, earlier insulin resistance, and earlier onset of Type 2 diabetes — often by 10 to 15 years compared to Western populations.
Central Obesity:
A waist circumference above 90 cm in Indian men is the single strongest predictor of insulin resistance — stronger than total body weight or BMI alone.
Sedentary Professional Life:
Urban IT professionals, bankers, and managers in Delhi NCR frequently sit for 9 to 11 hours daily. Prolonged sitting — independent of exercise habits — impairs insulin-mediated glucose uptake.
High Refined Carbohydrate Diet:
The typical North Indian male diet is heavily rice, wheat, maida, and potato dependent — all high glycaemic index foods that progressively exhaust pancreatic capacity over years.
Delayed Medical Help-Seeking:
Multiple Indian studies confirm men seek medical attention an average of 2 to 4 years later than women for identical symptoms. Pre-diabetes frequently progresses to confirmed Type 2 diabetes before the first clinical consultation.
ICMR BMI thresholds for Indians:
Screening Recommendations for Indian Men:
India has approximately 136 million pre-diabetic individuals. The majority have no idea. Pre-diabetes is not a softer version of diabetes. It is active metabolic damage. Cardiovascular risk begins rising at glucose levels well within the pre-diabetic range, years before the formal diabetes threshold is crossed.
Test Type | Pre-Diabetes Glucose Range | Clinical Term |
Fasting (FBS) | 100 to 125 mg/dL | Impaired Fasting Glucose (IFG) |
Post-Meal (PPBS) | 140 to 199 mg/dL | Impaired Glucose Tolerance (IGT) |
HbA1c | 5.7% to 6.4% | Pre-Diabetes |
Yes. Definitively. The Diabetes Prevention Program (DPP), the largest lifestyle intervention trial ever conducted, followed 3,234 pre-diabetic adults for 2.8 years:
Step 1: Do not ignore it. It will not normalize on its own.
Step 2: Get a confirmatory HbA1c test to understand your 3-month average.
Step 3: Consult a diabetologist for a structured reversal plan.
Step 4: Get a dietary assessment. Most pre-diabetic Indians consume 300 to 400g of refined carbohydrate per day. Reducing to 100 to 150g of complex carbohydrate is the single most impactful dietary intervention.
Step 5: Begin 30 minutes of brisk walking 5 days per week. Even this modest amount produces measurable improvements in insulin sensitivity within 2 weeks.
Step 6: Retest in 3 months.
Felix Hospital Diabetes Reversal Program — Noida
If your reading falls between 100 and 125 mg/dL (fasting) or 5.7% to 6.4% (HbA1c), you have a distinct clinical window to reverse this before it becomes permanent. Our specialized Diabetology team provides a structured, evidence-based pre-diabetes reversal program incorporating medical supervision, dietary counselling, tailored exercise planning, and quarterly HbA1c monitoring.
Appointment Link: felixhospital.com/book-appointment
24/7 Helpline: +91 96670 64100
Facility Address: Felix Hospital, Sector 137, Noida Expressway, Uttar Pradesh
Availability: Walk-in available 7 days a week. Same-day lab results reviewed by DM Diabetologist.
High blood sugar gets most of the attention. Low blood sugar (hypoglycemia) is equally dangerous and kills faster.
Classification and Emergency Response:
| Seveity Level | Blood Sugar Threshold | Typical Symptoms | Immediate Action Required |
| Level 1 (Alert) | 54 to 70 mg/dL | Shakiness, sweating, hunger, rapid heartbeat | 15g fast carbohydrate (glucose tablets / 150ml fruit juice). Recheck in 15 minutes. |
| Level 2 (Significant) | Below 54 mg/dL | Confusion, slurred speech, severe weakness, visual disturbances | Immediate glucose intake. Call doctor if no improvement in 10-15 minutes. |
| Level 3 (Severe) | Below 40 mg/dL or unconscious | Seizure, loss of consciousness, unresponsiveness | MEDICAL EMERGENCY. Call ambulance immediately. IV dextrose or glucagon required. Do not give anything orally to an unconscious person. |
The 15-15 Rule for Mild Hypoglycemia:
Consume 15 grams of fast-acting carbohydrate. Wait 15 minutes. Recheck blood sugar. If still below 70 mg/dL, repeat. Once blood sugar normalises, eat a small snack containing protein and complex carbohydrate to prevent recurrence.
15g fast carbohydrate examples for Indian patients:
HbA1c (%) | Average Glucose (mg/dL) | Clinical Status & Interpretation |
4.0% | 68 mg/dL | Below normal — investigate for hypoglycemia disorder |
5.0% | 97 mg/dL | Optimal non-diabetic level |
5.7% | 117 mg/dL | Upper limit of normal (pre-diabetes threshold) |
6.0% | 126 mg/dL | Pre-diabetes range |
6.5% | 140 mg/dL | Diabetes threshold for diagnosis |
7.0% | 154 mg/dL | General treatment target for most diabetic adults |
7.5% | 169 mg/dL | Slightly above target — review treatment protocol |
8.0% | 183 mg/dL | Poorly controlled — review medication, adherence, and diet |
8.5% | 197 mg/dL | High risk of microvascular complications (kidney/nerves) |
9.0% | 212 mg/dL | Very poorly controlled metabolism |
10.0% | 240 mg/dL | High complication risk — urgent medical intervention required |
11.0% | 269 mg/dL | Dangerous metabolic state — likely high symptom burden |
12.0% | 298 mg/dL | Critical emergency — hospitalization may be warranted |
Practical Example: If your HbA1c is 8.2%, your blood sugar has been averaging approximately 188 mg/dL over the past three months — nearly 90 mg/dL above the normal average of 97 mg/dL. That gap represents continuous, silent damage to blood vessels, nerves, and kidneys.
Once diagnosed, management targets differ from diagnostic thresholds. These are the ADA 2026 and ICMR targets for established diabetic patients.
Measurement Point | Type 1 Diabetes Targets | Type 2 Diabetes Targets | Elderly Patient Targets (65+) |
Fasting / Pre-Meal | 80 to 130 mg/dL | 80 to 130 mg/dL | 90 to 150 mg/dL |
Post-Meal (2 hours) | Less than 180 mg/dL | Less than 180 mg/dL | Less than 200 mg/dL |
Bedtime | 90 to 150 mg/dL | 90 to 150 mg/dL | 100 to 180 mg/dL |
HbA1c Target | Below 7.0% | Below 7.0% | Below 8.0% |
These are population-level defaults. Your diabetologist will adjust your personal targets based on how long you have had diabetes, presence of complications, cardiovascular history, and other medications.
Never adjust your diabetes medication based on a chart alone. The chart tells you where you are. Only your doctor can tell you what to do about it.
A non-diabetic person typically peaks within 45 to 60 minutes and returns to fasting baseline by the 2 to 3-hour mark. This hour-by-hour timeline shows the difference in metabolic response:
Time After Meal | Normal Non-Diabetic Curve | Target for Confirmed Diabetic |
30 minutes | 110 to 150 mg/dL | Not routinely measured |
45 to 60 minutes | Peak: 130 to 160 mg/dL | Peak: Below 200 mg/dL |
1 hour | Below 140 mg/dL | Below 180 mg/dL |
2 hours | Below 120 mg/dL | Below 180 mg/dL |
3 hours | Back to fasting baseline | Below 140 mg/dL |
Key insight: A person with impaired insulin response peaks later, reaches a higher peak, and takes much longer to return — causing extended glucose exposure to blood vessel walls, eyes, kidneys, and nerves. This is the mechanism by which post-meal hyperglycemia causes damage even when HbA1c appears reasonably controlled.
Understanding the signs of both extremes is vital. If blood sugar rises too high or falls too low, the physical alarm responses differ significantly.
Critical warning for Indian patients observing religious fasts: Patients on insulin, sulphonylureas (glibenclamide, glimepiride, gliclazide), or high-dose metformin who observe prolonged fasts during Navratri, Ramadan, or Ekadashi are at significant hypoglycemia risk. Always consult your diabetologist before any religious fast to adjust medications.
Many non-food variables cause short-term fluctuations in blood glucose readings. Understanding these variables prevents panic and allows for accurate data recording.
The OGTT is the definitive diagnostic test for glucose metabolism disorders, including gestational diabetes and cases where fasting glucose is borderline.
Reading Point | Normal Condition | Pre-Diabetes State | Diabetes Established |
Fasting | Less than 100 mg/dL | 100 to 125 mg/dL | 126 mg/dL or above |
1-Hour Post-Drink | Less than 180 mg/dL | (guideline varies) | (not used for diagnosis) |
2-Hour Post-Drink | Less than 140 mg/dL | 140 to 199 mg/dL | 200 mg/dL or above |
| High-Risk Group Designation | Scientific/Clinical Justification | Recommended Clinical Action |
First-degree relative with diabetes | 40% genetic heritability in immediate family | Screen annually starting from age 30 |
Indian / South Asian above 40 years | Thin-fat phenotype; early metabolic onset | Annual FBS + HbA1c screen |
BMI above 23 with central obesity | Visceral fat drives insulin resistance factors | Screen immediately regardless of age |
Women with history of GDM | 35% to 60% subsequent life conversion risk | Annual post-delivery evaluation |
Women with PCOS | 70% have underlying insulin resistance | Screen from the time of initial diagnosis |
Postmenopausal women | Shedding of estrogen reduces cellular sensitivity | Annual screening from age 45 |
Urban office workers — sedentary | 9+ hours daily of static desk sitting | Annual screening from age 35 |
Individuals with hypertension | Shared pathways of vascular and insulin resistance | Screen immediately |
Individuals with dyslipidemia | Core metabolic syndrome feedback loop | Screen immediately |
Patients on long-term steroids | Steroid-induced hepatic glucose output | Screen regularly while on steroids |
History of heart attack or stroke | Diabetes accelerates cardiovascular disease (CVD) | Screen immediately and manage aggressively |
Screening Frequency Guidelines:
• High-risk adults: Annual fasting blood sugar and HbA1c
• Average-risk adults above 35 years: Every 1 to 2 years
• Adults above 45 years regardless of risk: Annual metabolic checking
High-Risk Group Designation | Scientific/Clinical Justification | Recommended Clinical Action |
First-degree relative with diabetes | 40% genetic heritability in immediate family | Screen annually starting from age 30 |
Indian / South Asian above 40 years | Thin-fat phenotype; early metabolic onset | Annual FBS + HbA1c screen |
BMI above 23 with central obesity | Visceral fat drives insulin resistance factors | Screen immediately regardless of age |
Women with history of GDM | 35% to 60% subsequent life conversion risk | Annual post-delivery evaluation |
Women with PCOS | 70% have underlying insulin resistance | Screen from the time of initial diagnosis |
Postmenopausal women | Shedding of estrogen reduces cellular sensitivity | Annual screening from age 45 |
Urban office workers — sedentary | 9+ hours daily of static desk sitting | Annual screening from age 35 |
Individuals with hypertension | Shared pathways of vascular and insulin resistance | Screen immediately |
Individuals with dyslipidemia | Core metabolic syndrome feedback loop | Screen immediately |
Patients on long-term steroids | Steroid-induced hepatic glucose output | Screen regularly while on steroids |
History of heart attack or stroke | Diabetes accelerates cardiovascular disease (CVD) | Screen immediately and manage aggressively |
Screening Frequency Guidelines:
The Glycaemic Index (GI) measures how quickly a food raises blood sugar on a scale of 0 to 100. Foods below 55 GI = slow glucose release. Foods above 70 GI = rapid glucose release.
Common Indian Foods Glycaemic Index (GI) Reference:
Food Source / Preparation | Glycaemic Index (GI) | Impact on Blood Sugar Levels |
White rice (plain boiled) | 72 to 83 | High — major contributor to post-meal spikes |
Basmati rice (cooked) | 50 to 58 | Medium-Low — better choice than white rice |
White bread / Maida roti | 71 to 85 | High — rapid absorption and pancreatic exhaust |
Whole wheat roti | 54 to 62 | Medium — solid standard choice with fiber |
Bajra (pearl millet) roti | 41 to 55 | Low-Medium — excellent clinical choice |
Jowar (sorghum) roti | 49 to 62 | Medium-Low — good alternative grain choice |
Potato (boiled) | 78 to 82 | High — spike activator |
Sweet potato (boiled) | 44 to 61 | Medium-Low — much safer than normal potato |
Rajma (kidney beans) | 29 to 34 | Low — excellent for blood sugar & lipid control |
Chana (chickpeas) | 28 to 36 | Low — one of the best choices for protein and low GI |
Masoor dal (red lentil) | 21 to 30 | Low — optimal staple source for daily meals |
Idli (steamed) | 80 to 86 | High — fermented but rice-heavy rapid digest |
Dosa (plain) | 77 to 82 | High — similar spike risk as standard white rice |
Oats (rolled, cooked) | 42 to 55 | Low-Medium — good stable breakfast option |
Apple | 36 to 40 | Low — excellent snack fruit with cellular protection |
Banana (ripe) | 51 to 55 | Medium — consume in moderation (not fully overripe) |
Mango (ripe, 1 medium) | 51 to 60 | Medium — portion control is absolutely essential |
Full fat milk | 27 to 34 | Low — protein/fat buffers natural lactose sugars |
Curd / Dahi | 14 to 23 | Very low — excellent supportive dietary index |
Sugar (white) | 65 to 70 | Medium-High — rapid simple energy disrupter |
The most effective single dietary intervention for blood sugar control is changing the sequence of your meal, not eliminating food groups.
Eat in this exact order:
1. Non-starchy vegetables first (palak, gobi, lauki, bhindi, salad) — fiber slows gastric emptying
2. Protein second (dal, paneer, egg, lean meat, curd) — further delays glucose absorption and stimulates satiety
3. Carbohydrates last (rice, roti, bread)
Studies show this eating sequence reduces post-meal glucose spikes by 30 to 40% compared to eating carbohydrates first — without any change in total caloric intake.
Aerobic Exercise:
Brisk walking, cycling, swimming, and dancing activate muscle glucose transporters (GLUT4) that pull glucose from the blood directly into muscle cells without requiring insulin. A single 30-minute brisk walk lowers blood sugar by 20 to 50 mg/dL. The effect lasts up to 24 hours.
Minimum recommendation: 150 minutes of moderate aerobic activity per week. This alone is sufficient to reduce HbA1c by 0.5 to 0.7% in Type 2 diabetics — equivalent to a low-dose oral medication.
Resistance Training:
Building skeletal muscle mass increases the body's long-term glucose disposal capacity. Resistance training twice weekly reduces HbA1c by an additional 0.3 to 0.5% beyond aerobic exercise alone.
The Post-Meal Walk:
A 15-minute walk within 30 minutes of eating is one of the highest-yield single interventions for post-meal blood sugar control. A study published in Diabetes Care showed that three 10-minute post-meal walks were more effective at lowering 24-hour blood sugar than one continuous 30-minute morning walk.
For Indian patients, this means walking 10 to 15 minutes after lunch and dinner — the two largest carbohydrate-heavy meals of the day.
For a healthy 40-year-old Indian adult, the targets are: fasting blood sugar 70 to 99 mg/dL, post-meal at 2 hours below 140 mg/dL, and HbA1c below 5.7%. However, Indian adults in this age group face elevated metabolic risk due to the thin-fat phenotype and sedentary urban lifestyle. A reading of 100 to 110 mg/dL fasting at age 40 should not be dismissed as 'borderline' — it warrants immediate lifestyle intervention and confirmatory HbA1c testing.
No. 110 mg/dL fasting is classified as Impaired Fasting Glucose — the pre-diabetes category. It requires: confirmatory HbA1c testing, dietary carbohydrate audit, initiation of daily exercise, and a consultation with a diabetologist. Approximately 25 to 30% of people with a fasting reading of 110 to 125 mg/dL will develop Type 2 diabetes within 5 years without intervention.
After a standard Indian meal containing rice or roti, blood sugar in a non-diabetic adult should peak below 140 to 150 mg/dL (usually between 45 to 60 minutes after eating) and return to fasting baseline below 110 mg/dL within 2 to 3 hours. If your 2-hour post-meal reading consistently exceeds 140 mg/dL after a normal-sized Indian meal, impaired glucose tolerance is present regardless of your fasting reading.
An HbA1c of 6.2% is in the pre-diabetic range (5.7% to 6.4%). It corresponds to an average blood glucose of approximately 131 mg/dL over the past 3 months. It requires immediate clinical attention and lifestyle intervention but does not yet constitute diabetes. Aggressive lifestyle modification can reduce HbA1c from 6.2% back to the normal range within 3 to 6 months.
Yes. Acute stress triggers cortisol and adrenaline release, both of which raise blood sugar. A single stressful blood draw can produce a reading 20 to 40 mg/dL above your true fasting baseline. However, consistently elevated readings on multiple different days indicate a genuine metabolic problem rather than situational stress. A single elevated reading during a stressful event should always be confirmed with a calm morning retest and HbA1c.
For non-GDM pregnant women, targets are: fasting below 95 mg/dL, 1-hour post-meal below 140 mg/dL, and 2-hour post-meal below 120 mg/dL. For GDM diagnosis (IADPSG / ICMR criteria): fasting at or above 92 mg/dL, 1-hour post 75g OGTT at or above 180 mg/dL, or 2-hour post 75g OGTT at or above 153 mg/dL — even a single value at these thresholds is sufficient for GDM diagnosis.
A 2-hour post-meal reading of 200 mg/dL or above meets the ADA and ICMR diagnostic threshold for diabetes when confirmed on a second occasion. A single such reading should be reported to a doctor immediately for confirmatory testing. It is not a reading to dismiss as 'just post-meal'.
This is the Dawn Phenomenon. Between 3 AM and 8 AM, the body releases growth hormone and cortisol to prepare for waking. These hormones signal the liver to release stored glucose and reduce insulin sensitivity, causing a natural morning rise. A related but opposite cause is the Somogyi Effect: if blood sugar drops too low during the night, the body releases counter-regulatory hormones causing a rebound morning spike. The two are distinguished by checking blood sugar at 3 AM — low at 3 AM indicates Somogyi Effect; normal or elevated at 3 AM indicates Dawn Phenomenon.
They measure different things and both are important. Fasting blood sugar is a single-moment snapshot. HbA1c is a 3-month average. A patient who eats cleanly the week before a test can have a normal fasting reading while their HbA1c reveals months of elevated average glucose. For initial screening and monitoring, always do both. HbA1c is the most reliable single test because it cannot be influenced by a single day of behavior.
Any reading above 300 mg/dL with symptoms — or above 400 mg/dL at any time — is a medical emergency. In Type 1 diabetics, severe hyperglycemia can progress to diabetic ketoacidosis (DKA): fruity-smelling breath, rapid breathing, vomiting, and decreasing consciousness. In Type 2 diabetics, it can progress to hyperosmolar hyperglycaemic state (HHS): extreme dehydration, confusion, and very high blood sugar sometimes above 600 mg/dL. Both require immediate hospital care. Any reading below 40 mg/dL, or any reading with unconsciousness or seizure, requires emergency hospital care immediately.
Dr. Ravi Sharma is a senior physician with 42+ years of experience, known for compassionate and comprehensive patient care in Noida.

Stay updated with trusted hospitals, specialist care, and ESIC-approved medical facilities across Noida.

Discover the updated list of Ayushman Bharat (PMJAY) hospitals in Dadri for 2026.

Looking for an Ayushman Bharat hospital in Delhi NCR? Discover how Felix Hospital provides quality healthcare services under the Ayushman Bharat Yojana in 2026.

Searching for Ayushman Card hospitals in Ghaziabad? Felix Hospital offers advanced medical care and cashless treatment facilities under the Ayushman Bharat Yojana in 2026.

Subscribe to our
© Copyright 2026. All Rights Reserved by Felix Healthcare Private Limited
Design and development by :


 +(91)9667064100
 Emergency : +(91)9667064100